
You can graph the values from a selection of metrics and indicators on your dashboards using the chart widget.
Configuring Chart Widgets
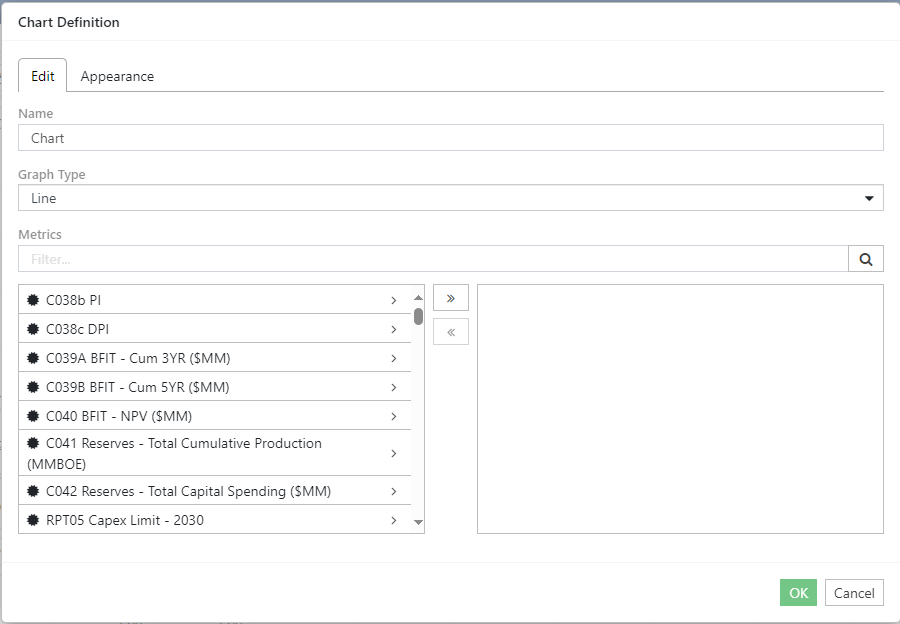
- Set up your chart:
- Enter a name for the chart in the Name field.
- Select the indicators and metrics to include in the chart. Click the Add button (
 next to a metric or indicator's name to add it to the chart. Click the Add All button (
 ) to add all of the metrics/indicators to the chart in one step.
 - To reorder the list of included metrics and indicators, click and hold the Reorder icon (
 ) next to the item you wish to move, and then drag and drop it onto a new position in the list.
 - Click OK to create the chart.
- Resize and reposition the widget, as required.
- Click the Save button to save your dashboard.
Click image to expand or minimize.
Chart Widget Options
To access the widget options
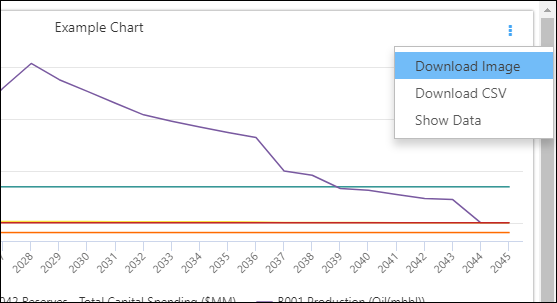
- Hover over a chart widget, the Options icon (
 ) will appear in the upper-right corner of the widget.
 - Click the Options icon to access the following options:
- Download Image: Select this option to download a copy of the chart in .png format.
- Download CSV: Select this option to export the chart's numeric data in an Excel-compatible file (.csv-formatted workbook).
- Show Data: Select this option to view all of the numeric data represented on the graph.
- To return to the chart, click the Options icon and select Show Chart.
Click image to expand or minimize.